GBP/USD Price Analysis: Grinds higher towards 1.1745-55 resistance zone
- GBP/USD bulls take a breather around two-week high, retreats of late.
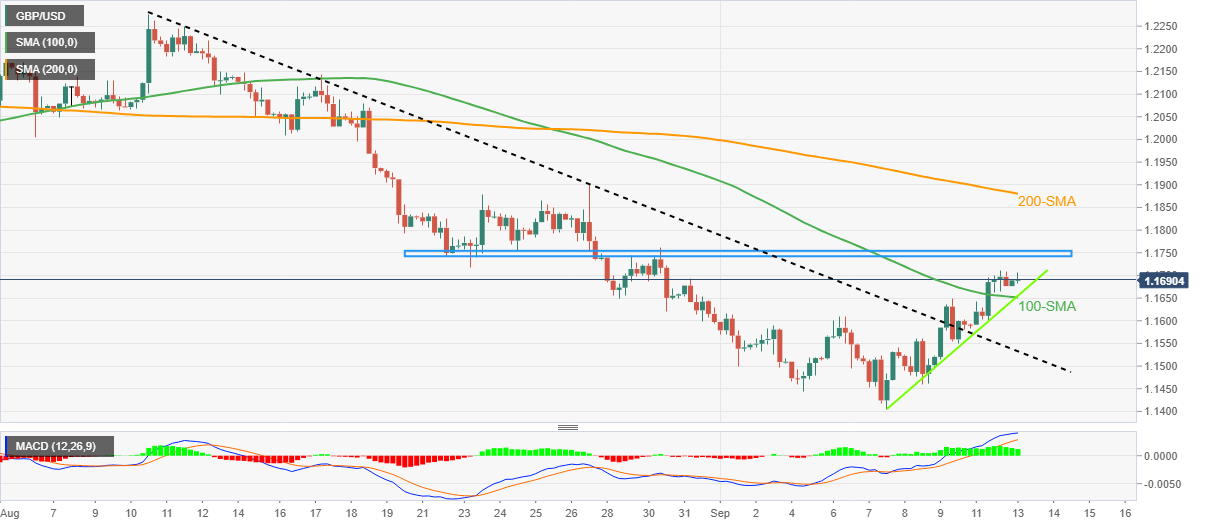
- Sustained trading beyond 1.1650-55 support confluence, bullish MACD signals favor buyers.
- Three-week-old horizontal area, 200-SMA challenge the upside moves, bears need validation from previous resistance line.
GBP/USD retreats to 1.1685 during Tuesday’s Asian session as traders await the key UK employment data, as well as the US Consumer Price Index (CPI). In doing so, the Cable pair struggles to extend the two-day uptrend near the fortnight high.
Even so, successful trading beyond the 1.1650-55 support, including the 100-SMA and a one-week-old ascending trend line, joins the bullish MACD signals to underpin the hopes of witnessing the pair’s further upside.
However, a horizontal area comprising multiple levels marked since August 22, between 1.1745 and 1.1755, appears a tough nut to crack for the GBP/USD buyers.
If at all the quote rises past 1.1755, the 200-SMA level surrounding 1.1880 could test the pair’s run-up before giving control to the bulls.
Alternatively, pullback moves remain elusive until staying beyond 1.1650-55 support confluence.
Following that, the previous resistance line from August 10, close to 1.1530 by the press time, will be important to watch as a downside break of the same could direct GBP/USD bears towards the yearly low marked in the last week around 1.1405.
GBP/USD: Four-hour chart
Trend: Further upside expected