Gold Price Forecast: Bearish RSI divergence tests XAU/USD rebound below $1,800, ECB eyed
- Gold holds post-Fed rebound from two-month low, sluggish of late.
- Fed’s faster tapering, hawkish dot-plot failed to supersede Omicron fears, indecision over rate hike timing.
- ECB is likely to signal PEPP conclusion but economic forecasts are the key.
- Gold Price Forecast: Lower lows at sight
Gold (XAU/USD) prices grind higher around $1,780, keeping post-Fed rebound from $1,753 during Thursday’s Asian session.
The yellow metal initially reacted to the US Federal Reserve (Fed) decision with a downside to multi-day low before the details triggered the ‘buy the rumor sell the fact’ move. Adding to the corrective pullback could be the market’s preparation for today’s European Central Bank (ECB) meeting and the year-end consolidation in gold prices.
Fed matched wide marked forecasts by doubling trimming the monthly bond purchases by $30 billion and the dot-plot also mentioned three rate hikes in 2022. However, Powell’s comments like “the Omicron variant poses risks to the outlook”, as well as refrain from rate hikes until the tapering is completed, recalled the gold buyers. It’s worth noting that stimulus hopes from the US and a run-up in the equities also helped the corrective pullback.
However, the markets remain divided as the US Treasury yields and the stock futures remain mostly steady ahead of the key ECB monetary policy meeting. That said, the regional central bank is up for closing the Pandemic Emergency Purchase Program (PEPP) but questions over Asset Purchase Program (APP) and economic forecasts will be crucial for the pair traders to watch for fresh impulse.
Read: European Central Bank Preview: More recalibration or actual tightening?
In addition to the ECB, preliminary readings of the monthly PMIs and Omicron updates will also be watched for additional clarity of the gold trades.
Technical analysis
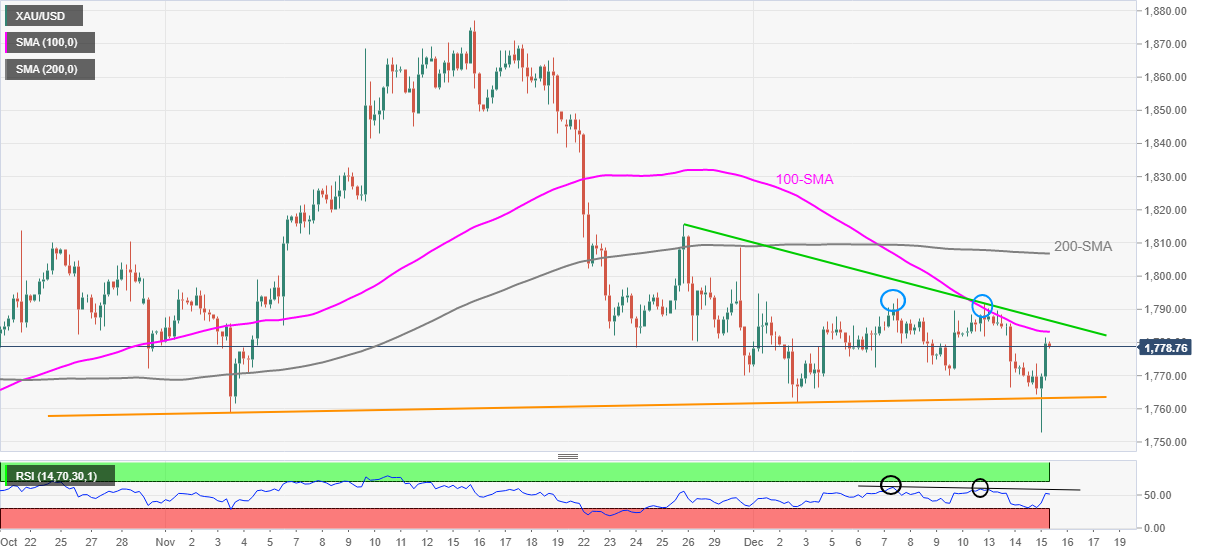
Although RSI rebound and failures to stay below a six-week-old support line defends XAU/USD bulls, the bearish divergence of the RSI and price momentum hints at the commodity’s pullback moves.
The RSI divergence can be identified when the RSI line disagrees with the price moves. In our case of bearish RSI divergence, the prices did make higher highs during December 08 and 13 but the RSI formed lower highs, suggesting a pullback.
That said, the stated immediate support line near $1,763 and the recent low near $1,753 can entertain intraday gold sellers before directing them to September’s low near $1,722.
Alternatively, 100-SMA and descending trend line from November 26, respectively near $1,783 and $1,787, restricts short-term advances of the commodity prices.
Following that, the $1,800 threshold and 200-SMA level near $1,807 will test the gold buyers before giving them controls.
Gold: Four-hour chart
Trend: Further weakness expected