US Dollar Index Price Analysis: DXY teases monthly resistance around 93.50
- DXY struggles around one-month high, sidelined of late.
- Multiple resistances challenge buyers, bears may not risk entries above 200-SMA.
US Dollar Index (DXY) seesaws around 93.47, after refreshing the monthly high with 93.52 during the early Asian session on Thursday.
Although the greenback gauge’s sustained trading beyond 200-SMA keeps buyers hopeful, multiple resistance lines do challenge the upside. Also favoring the DXY bulls are the MACD signals.
Hence, an upside break of the one-month-old resistance line, near 93.50, becomes imminent.
However, an 11-day-long resistance line at 93.67 and the upper boundary of a 13-day-old rising channel, close to 93.77 will challenge the DXY bulls afterward. It’s worth noting that the yearly high, flashed last month, around 93.72 adds to the upside filters.
Meanwhile, pullback moves may attempt to defy the bullish channel formation while targeting a 93.00 breakdown.
Even so, the 200-SMA level of 92.82 becomes the key hurdle for the US Dollar Index bears to tackle before retaking the controls.
DXY: Four-hour chart
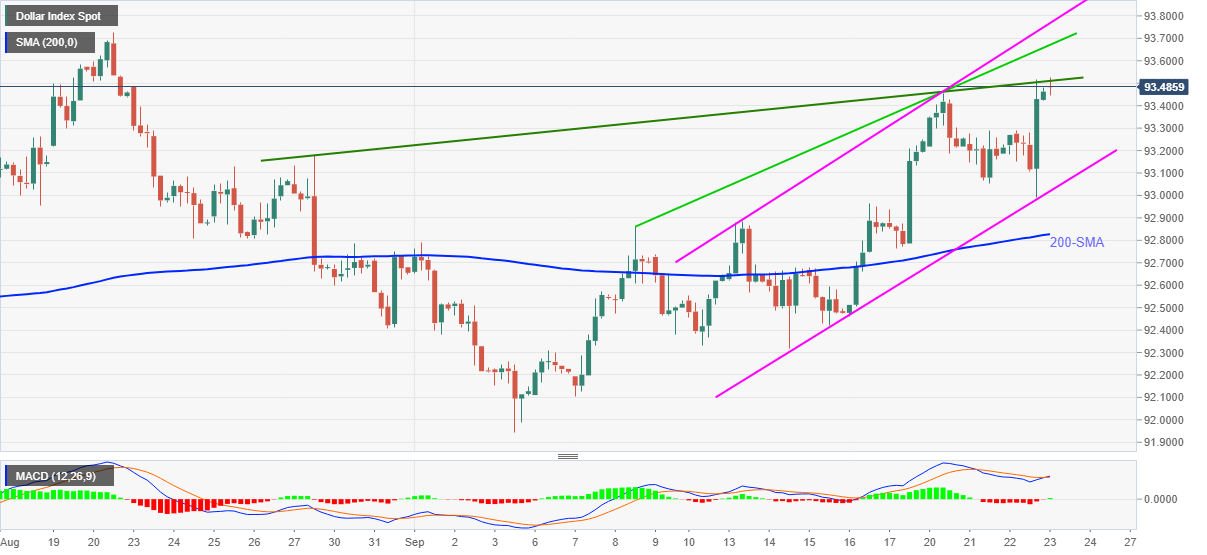
Trend: Bullish