NZD/USD Price Analysis: Defensive around 200-SMA amid mixed clues
- NZD/USD keeps recovery moves from monthly low, picks up bids of late.
- 200-SMA, weekly resistance line challenge bulls amid sluggish Momentum line.
- Bears keep 50% Fibonacci retracement level on the radar.
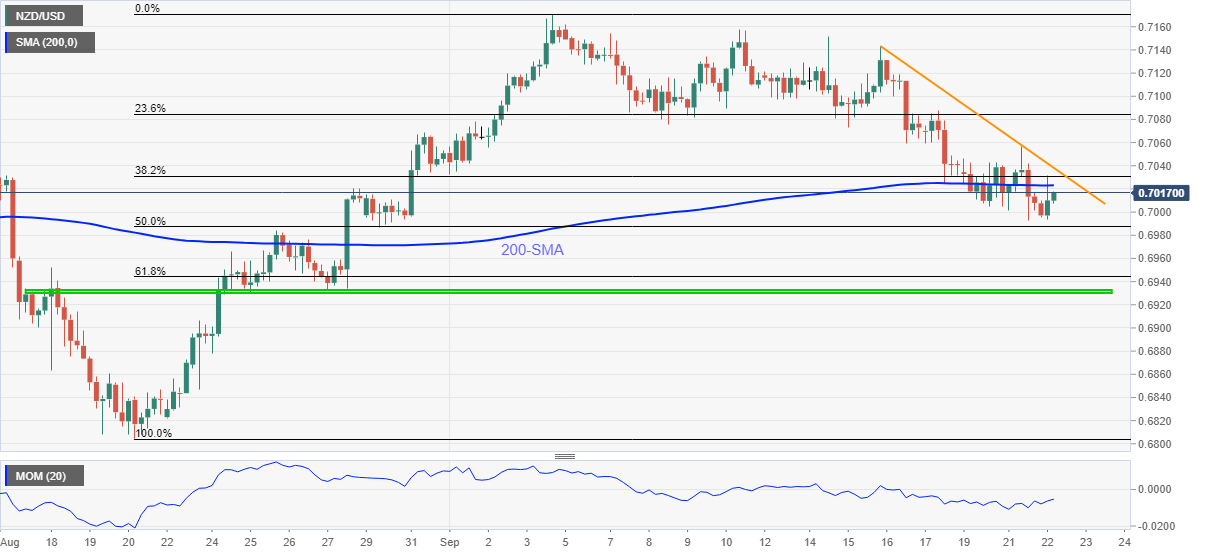
NZD/USD holds onto a rebound from the monthly bottom, recently picking up bids to 0.7015 heading into Wednesday’s European session. In doing so, the Kiwi pair registers 0.13% intraday gains, the most in over a week by the press time.
Even so, the sluggish Momentum line keeps the quote capped around 200-SMA, not to forget mentioning the trade below one-week-old trend line resistance.
Hence, the recovery moves remain less important before crossing the resistance line figures of 0.7040. Before that, the key moving average near 0.7025 guards immediate upside.
In a case where NZD/USD rises past 0.7040, the 0.7080 and the 0.7100 levels may entertain the pair buyers ahead of the monthly peak of 0.7171.
On the flip side, 50% Fibonacci retracement of the late August to early September upside, around 0.6985, restricts the pair’s nearby downside.
Also, important support is a horizontal area comprising multiple levels marked since August 17, close to 0.6930.
Overall, NZD/USD remains pressured towards the sub-0.7000 area but intermediate consolidation can’t be ruled out.
NZD/USD: Four-hour chart
Trend: Further weakness expected