WTI Price Analysis: Turns south after rejection at critical 100-DMA resistance
- WTI eases from six-day highs, as 100-DMA caps the recovery rally.
- Impending bear cross and bearish RSI weigh on WTI prices.
- Path of least resistance appears to the downside for oil
WTI (NYMEX futures) is reversing a dip below $67, consolidating the two-day recovery rally, as the bulls ran into a strong overhead around $67.90 earlier this Wednesday.
The dour market mood is doing little to help the WTI bulls, as they the black gold trade listlessly so far, off the six-day highs of $67.72 reached a day before.
From a short-term technical perspective, WTI sellers have regained control following a rejection at the horizontal 100-Daily Moving Average (SMA) at $67.89.
The bears need to crack the daily lows of $66.92 to flex their muscles towards the $66.50 psychological barrier.
If the sell-off deepens, then WTI bulls could seek the support of Tuesday’s low at $65.34.
The 14-day Relative Strength Index (RSI) has turned south below the midline, suggesting that the bearish grip is likely to tighten ahead.
Further, the 21-DMA is looking to pierce through the 100-DMA from above, paving way for a potential bear cross confirmation, which adds credence to the downturn in prices.
WTI: Daily chart
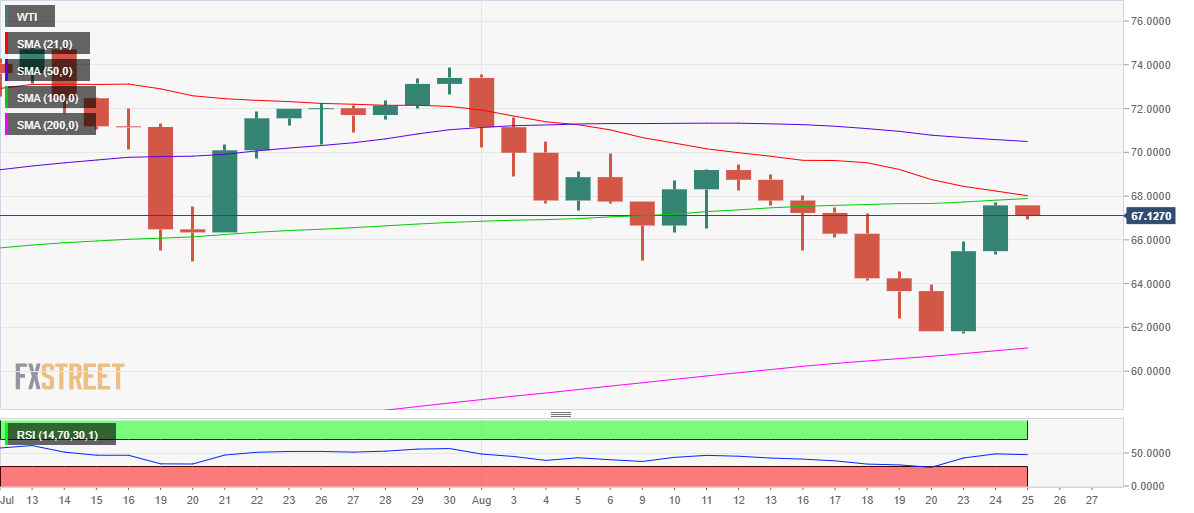
On the upside, acceptance above the 100-DMA could expose immediate resistance at the bearish 21-DMA at $68.02.
The bulls will then make an effort towards the August 12 high of $69.42. The $70 round number is the level to beat for the WTI optimists.
WTI: Additional levels to watch