Gold Price Forecast: XAU/USD’s downside remains exposed towards $1790 – Confluence Detector
- Gold price targets levels sub-$1800 as USD remains in a win-win situation.
- US Senate vote on infrastructure bill eyed amid lack of relevant economic news.
- Gold Weekly Forecast: Possible correction to $1,800 as key resistance holds.
Gold price is extending previous losses following the rejection at the critical SMA200 one-day resistance at $1825. The rebound in the US Treasury yields is weighing on the yieldless gold amid risk-on sentiment, as the European market rises on strong earnings and positive close on Wall Street overnight. Meanwhile, broad-based US dollar strength also keeps gold price undermined, with the Delta covid variant concerns boosting the dollar’s safe-haven appeal. The greenback also draws support from the uptick in the yields, as the focus now shifts towards the US Senate’s early test vote on President Joe Biden’s infrastructure bill.
Gold’s fate hinges on the outcome of the key vote due later in the day and the dynamics in the yield and the dollar amid incoming virus updates and earrings reports. For now, the King dollar remains in a win-win situation, as a drive for safety remains in the backdrop.
Read: Gold Price Forecast: XAU/USD eyes a sustained move below $1800 amid bearish technicals
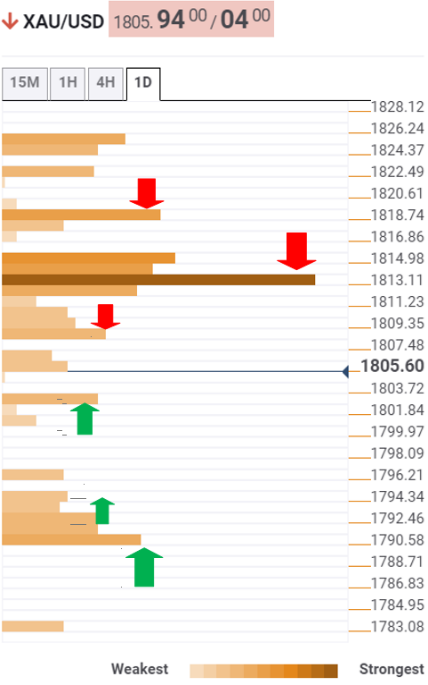
Gold Price: Key levels to watch
The Technical Confluences Detector shows that gold price is heading towards minor support around $1802, which is the convergence of the pivot point one-day S1, Bollinger Band four-hour Lower.
A sharp drop towards Bollinger Band one-day Middle at $1796 cannot be ruled on a breach of the latter.
The sellers will then need to clear a dense cluster of support levels around $1793, where the SMA100 one-day, pivot point one-day S2 and the previous week’s low meet.
The intersection of the Fibonacci 23.6% one-month and pivot point one-week S1 at $1790 will test the bearish commitments.
Alternatively, recapturing $1809 barrier (Fibonacci 61.8% one-week) is critical to initiate any meaningful recovery towards powerful resistance at $1814, SMA200 four-hour and Fibonacci 38.2% one-month coincide.
Acceptance above the latter will call for a test of the $1819 level, the confluence of the SMA5 one-day and Fibonacci 38.2% one-week.
Here is how it looks on the tool
About Technical Confluences Detector
The TCD (Technical Confluences Detector) is a tool to locate and point out those price levels where there is a congestion of indicators, moving averages, Fibonacci levels, Pivot Points, etc. If you are a short-term trader, you will find entry points for counter-trend strategies and hunt a few points at a time. If you are a medium-to-long-term trader, this tool will allow you to know in advance the price levels where a medium-to-long-term trend may stop and rest, where to unwind positions, or where to increase your position size.