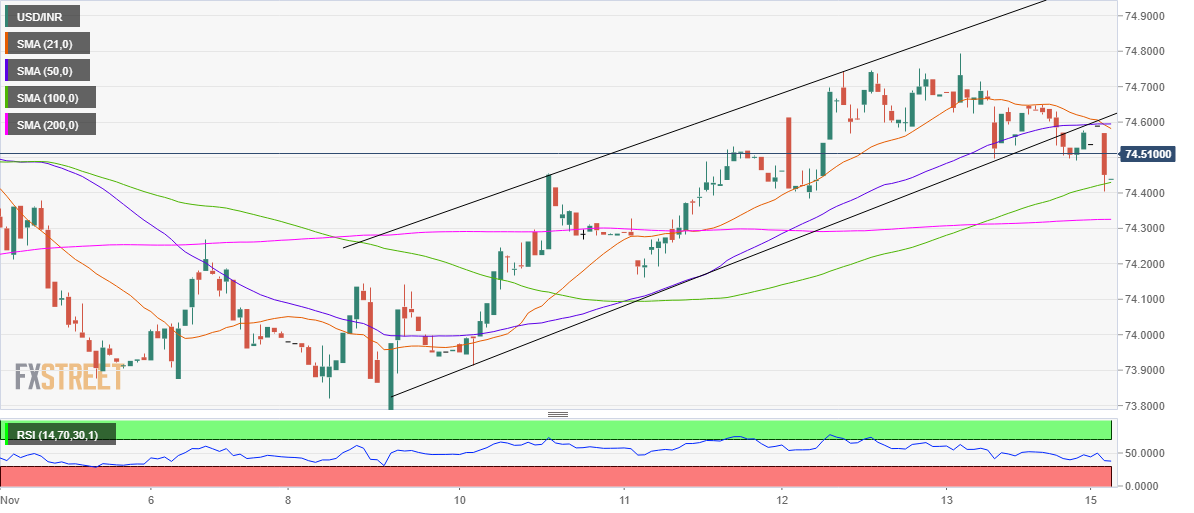
USD/INR Price News: Indian rupee tests 100-HMA on road to recovery
- Rupee bulls fight back control following the recent decline.
- USD/INR charts rising channel breakdown on the daily sticks.
- More losses likely amid bearish crossover, RSI.
USD/INR extends pullback from weekly highs of 74.80 into Monday, as the bulls take a breather amid a chart-driven downside signal.
Looking at the technical picture, the cross confirmed a rising channel breakdown on the hourly chart last Friday and since then looks vulnerable amid a bearish crossover spotted in the last hour.
The 21-hourly simple moving average (HMA) pierced the 50-HMA from above, following which the price saw a sharp 20-pips down move.
Although the 100-HMA at 74.40 came to the rescue of the bulls, offering some support to the spot.
Acceptance below the latter could bring the 200-HMA support in play at 74.32.
To the upside, a strong confluence around 74.60 could limit the recovery attempts. At the level, the pattern support now resistance coincides with the 21-HMA and 50-HMA.
The next relevant target for the buyers remains the weekly tops of 74.80.
USD/INR: Hourly chart

USD/INR: Additional levels
