Back
11 Sep 2020
WTI Price Analysis: Teasing head-and-shoulders breakdown on 1H chart
- WTI consolidates the downside before the next leg lower.
- US oil charts a potential head-and-shoulders pattern on hourly chart.
- Trades below all major HMAs, with bearish RSI.
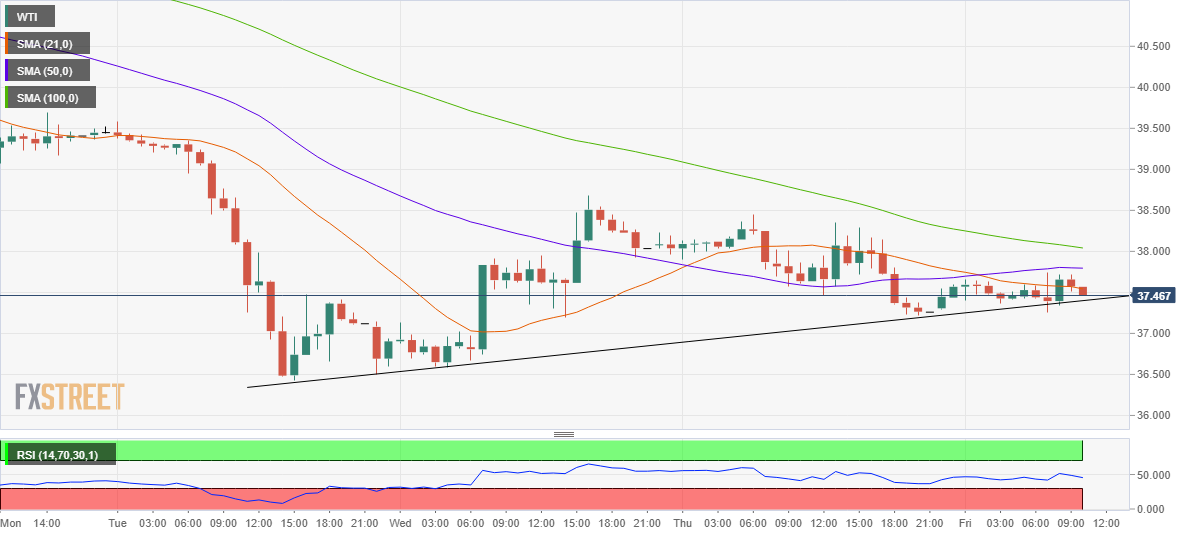
The choppy trading in WTI (futures on Nymex) over the few days has carved out a head-and-shoulders pattern on the hourly sticks.
The price is on the verge of a pattern breakdown, as it flirts with a neckline at 37.39. A sustained closing below the latter will open floors for a test of the pattern target at 35.50.
On its way to the pattern target, the bears could challenge multi-month lows at 36.42.
Alternatively, any bounce will confront the horizontal 50-hourly Simple Moving Average (HMA) at 37.80.
Acceptance above the latter could add legs to the corrective bounce towards the 100-HMA at 38.05.
The hourly Relative Strength Index (RSI) remains in the bearish territory, pointing south at 45.15, indicative of the further declines.
WTI: Hourly chart
WTI: Additional levels