Back

27 Mar 2020
USD/JPY Price Analysis: US dollar extends losses vs. Japanese yen, trades near 108.00 figure
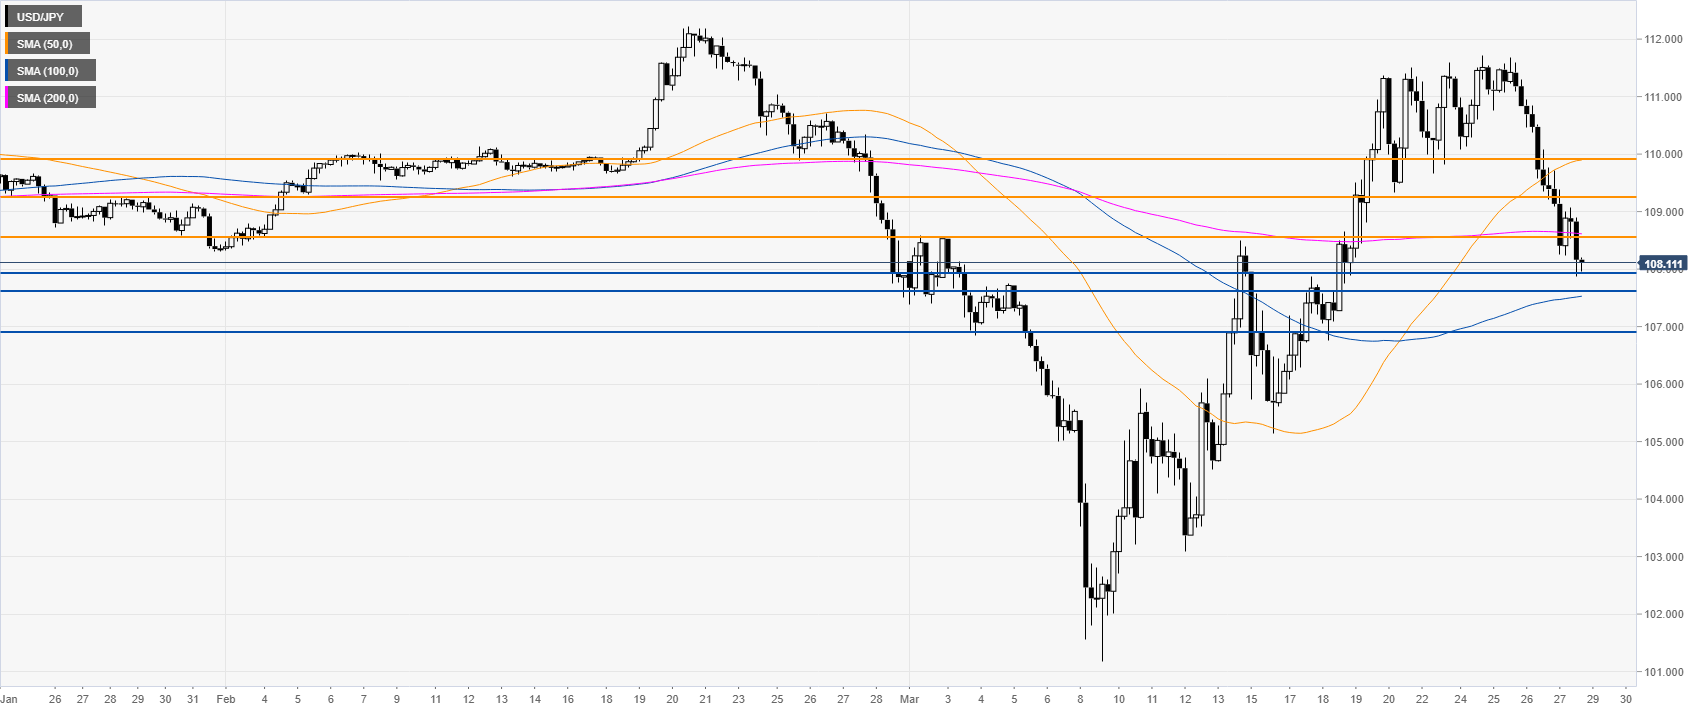
- USD/JPY easing from monthly tops while breaking below the 200 SMA on the four-hour chart.
- Support is seen in the 108.00/107.60 price zone.
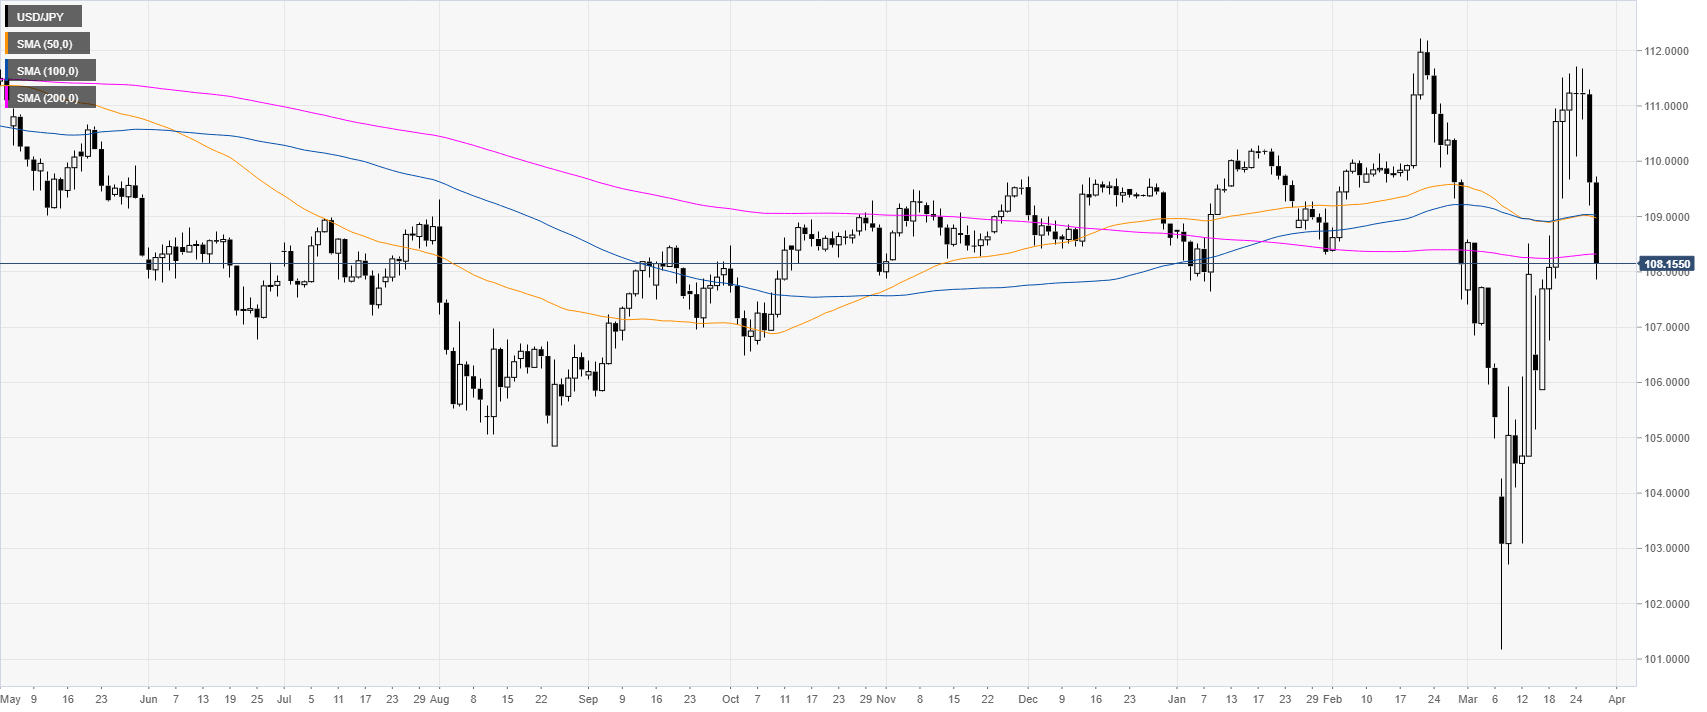
USD/JPY daily chart
USD/JPY is retreating down from monthly tops as the spot is challenging the 200 SMA on the daily chart.
USD/JPY four-hour chart
USD/JPY declined to the 10.800 figure below the 50 and 200 SMAs. Bulls want to generate a bounce but a break above 109.24 would be needed as confirmation. On the other hand, sellers will take advantage of the negative momentum to break below the 108.00/107.60 support zone en route towards the 106.88 level, according to the Technical Confluences Indicator.

Resistance: 108.55, 109.24, 110.00
Support: 108.00, 107.60, 106.88
Additional key levels

