Back
23 Oct 2018
GBP/USD Technical Analysis: Tumbling into 1.2950 as bears get brave, downside channel holding
- The past twenty-four hours have seen the GBP/USD trading into the basement after slipping from yesterday's peak of 1.3090 in a last-ditch attempt to recover the 1.3100 major handle, but the Sterling couldn't find the bullish drive as Brexit headlines continue to erode investor confidence in the Pound, and the Cable is now accelerating its bearish momentum.
- GBP/USD analysis: the end of a Brexit deal hopes?
GBP/USD, M5
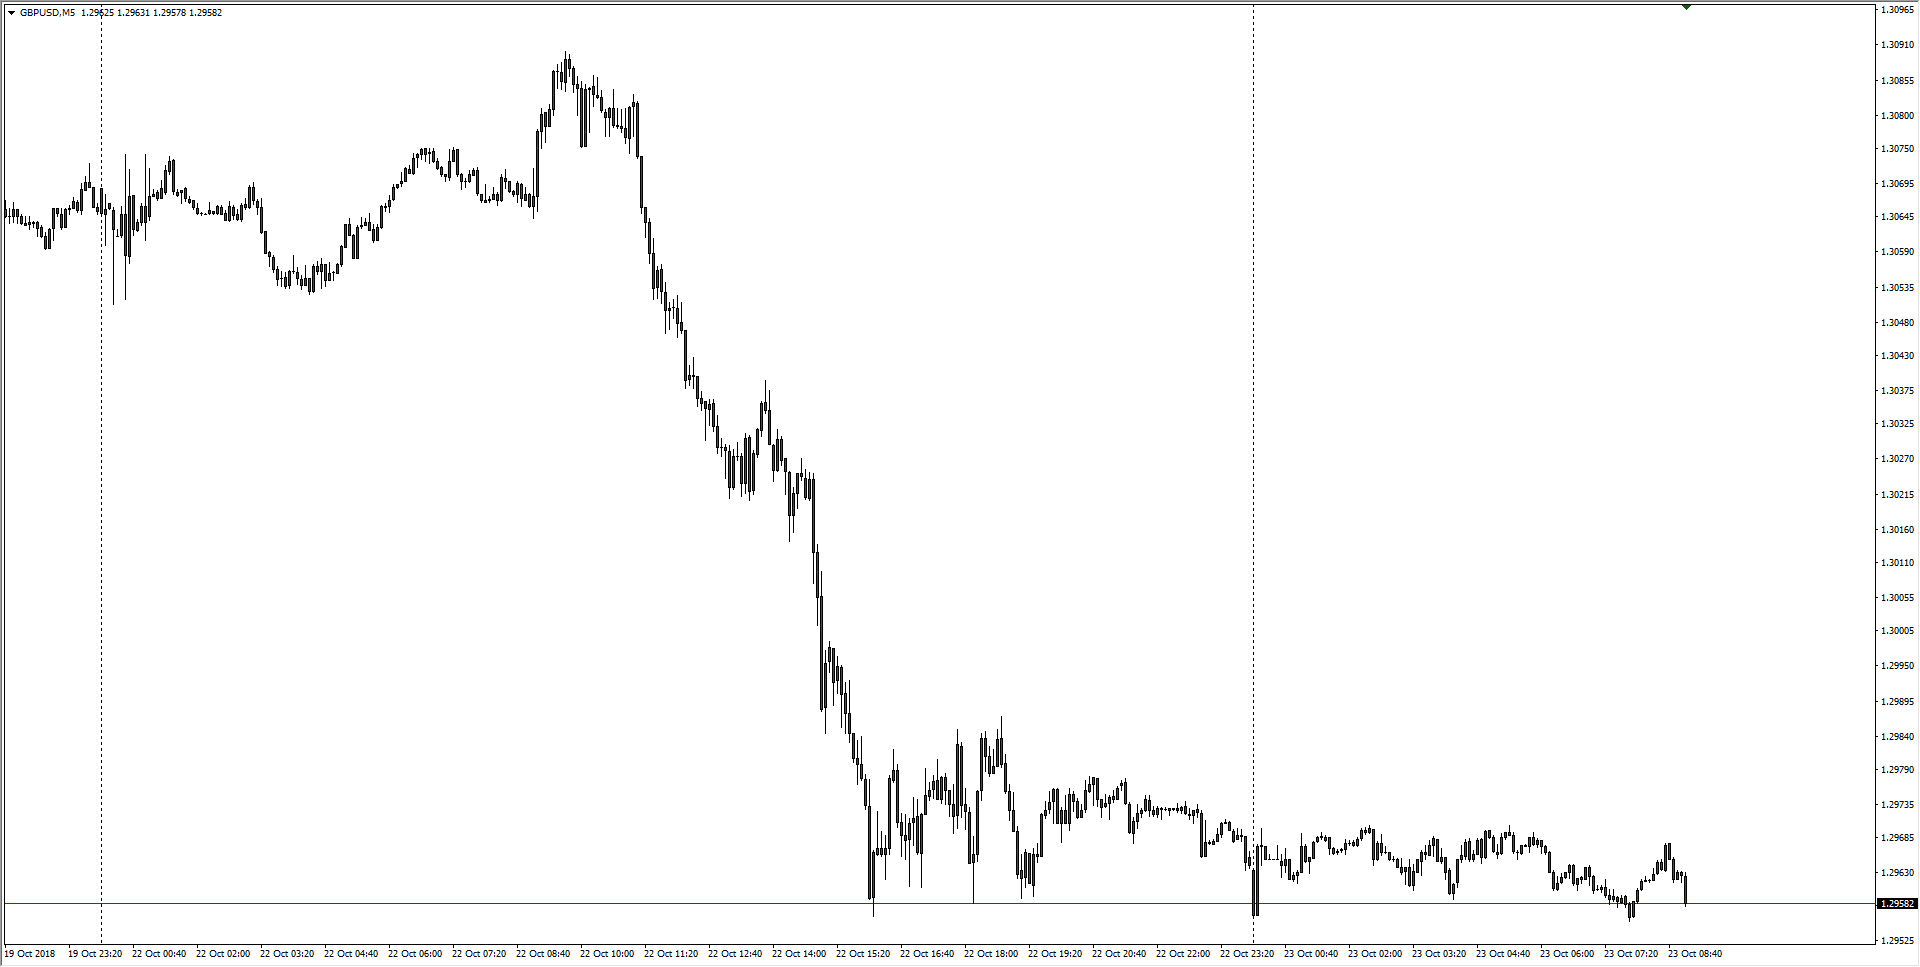
- The previous trading week sees the Cable maintaining downside momentum, clipping steadily down beneath a descending trendline, and GBP/USD buyers are moving out of the way as shortsellers push the pair into 1.2950.
GBP/USD, M30
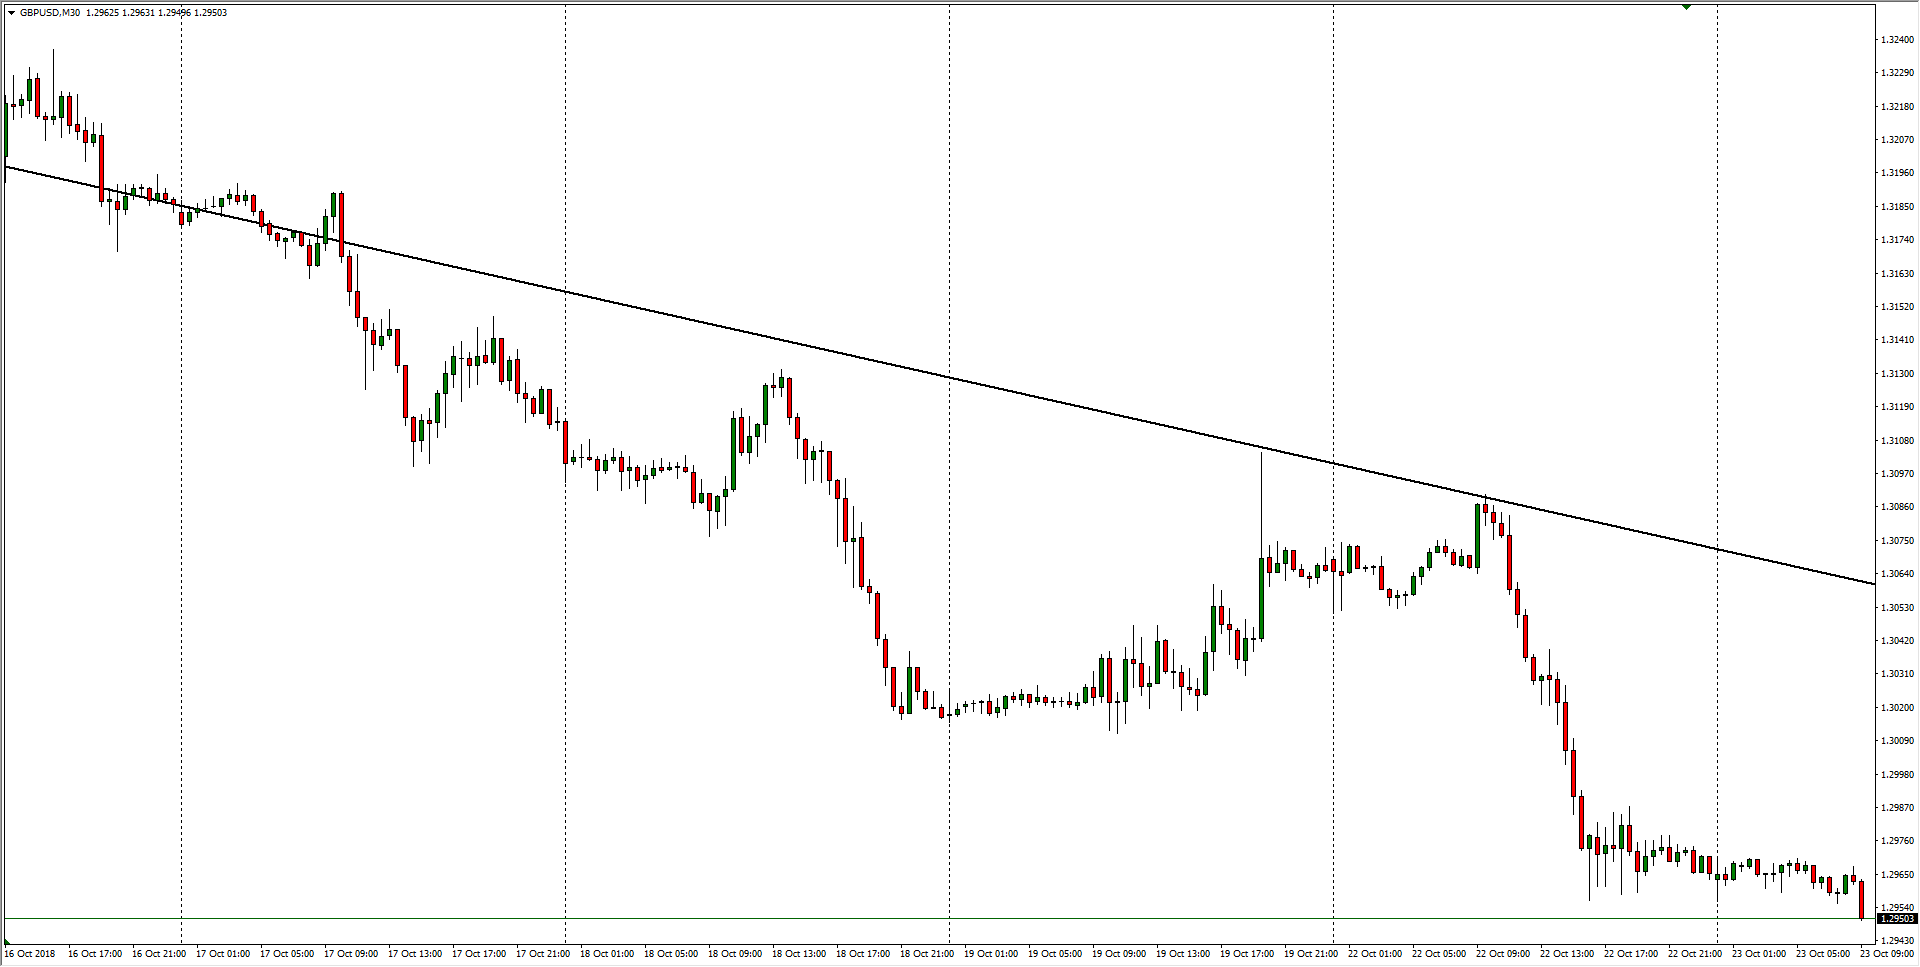
- Looking back over the past month, the Cable is threatening to fall out the bottom side of a declining channel, but support threatens the current downside move from 2018's technical bottom at 1.2922.
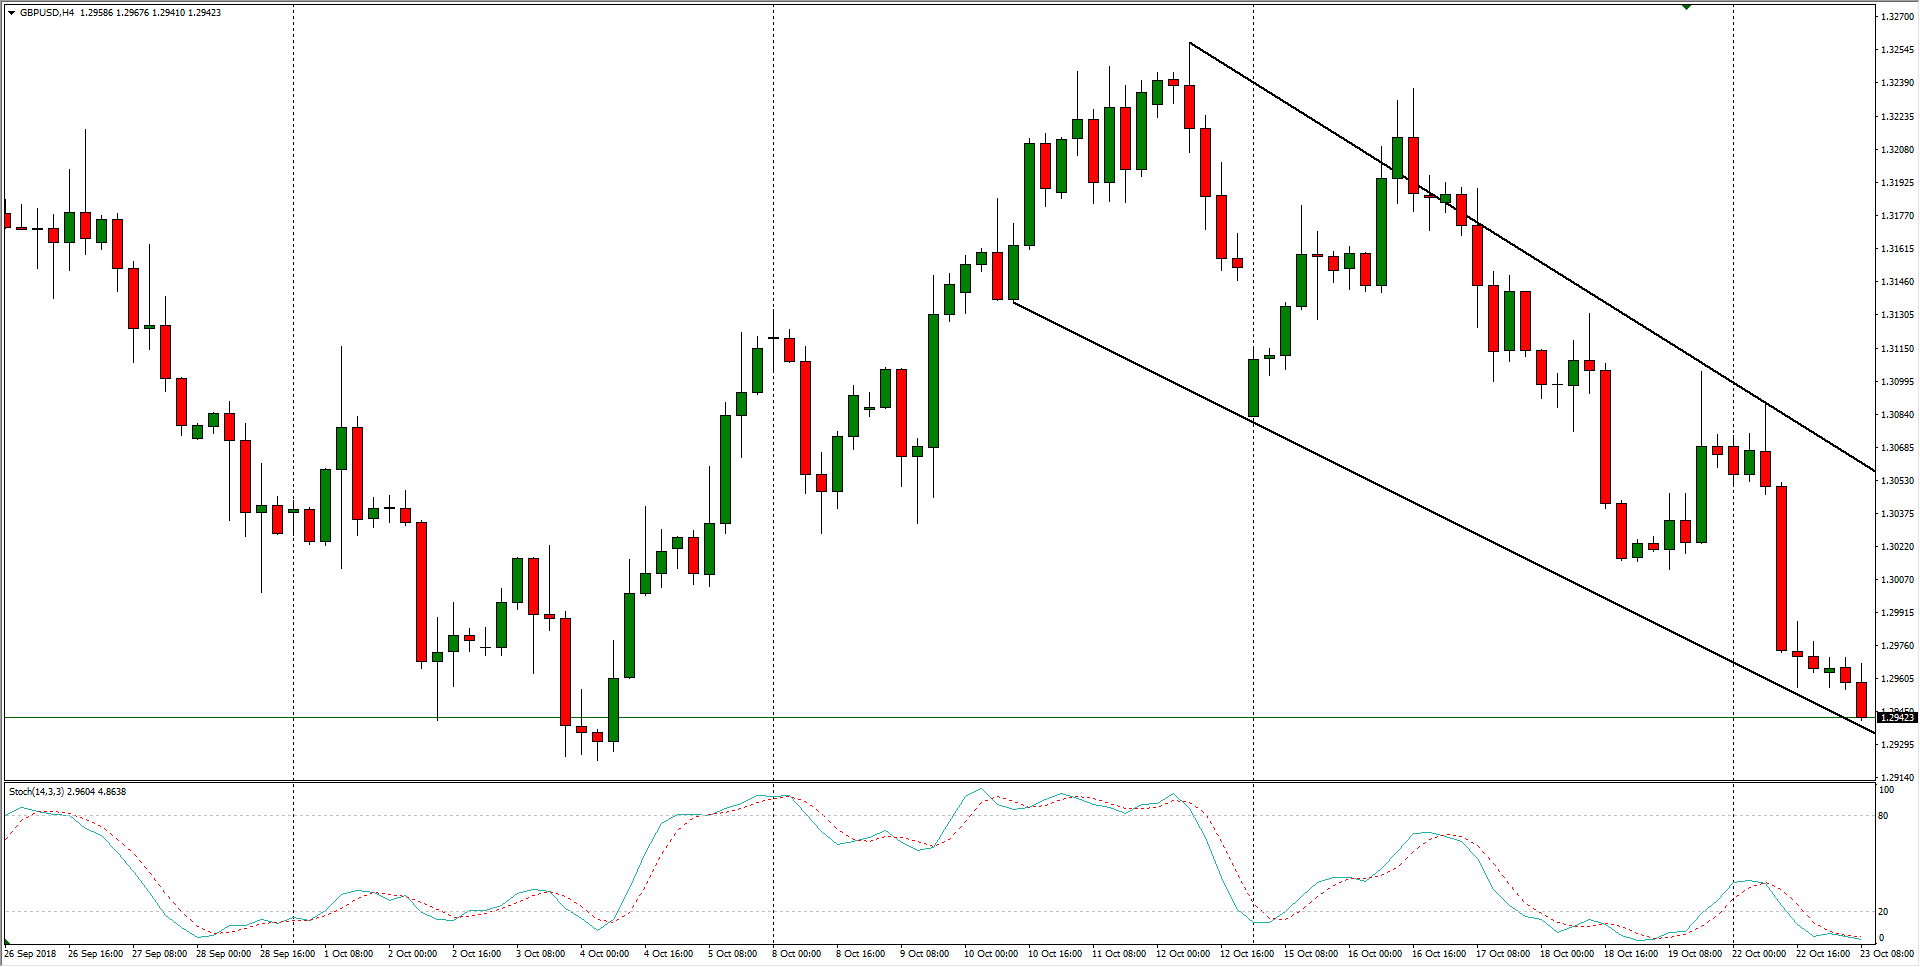
GBP/USD, H4
GBP/USD
Overview:
Last Price: 1.2963
Daily change: -5.0 pips
Daily change: -0.0386%
Daily Open: 1.2968
Trends:
Daily SMA20: 1.3094
Daily SMA50: 1.3009
Daily SMA100: 1.3088
Daily SMA200: 1.3477
Levels:
Daily High: 1.3092
Daily Low: 1.2956
Weekly High: 1.3238
Weekly Low: 1.3011
Monthly High: 1.33
Monthly Low: 1.2786
Daily Fibonacci 38.2%: 1.3008
Daily Fibonacci 61.8%: 1.304
Daily Pivot Point S1: 1.2919
Daily Pivot Point S2: 1.287
Daily Pivot Point S3: 1.2784
Daily Pivot Point R1: 1.3054
Daily Pivot Point R2: 1.314
Daily Pivot Point R3: 1.3189